
10 Metrics that every D2C Brand Should Look Into
The D2C brand strategy is becoming increasingly popular. There are companies finding fortune by selling products directly to the public that are either more economical or of top standard.
From 2015 to 2025, India’s total addressable D2C market – which includes both online and offline direct-to-consumer sales – is predicted to rise fifteen-fold. The Indian direct-to-consumer market was valued at 33 billion dollars in 2020, and it is expected to triple in size by 2025, reaching 100 billion dollars. (Statista)
Before investing in a specific market segment, whether B2B, B2C, or D2C, we as a business must understand and analyze the pros and cons, as well as the resulting profitability over a given time period. Customers are more likely to choose brands that cut costs and price items at a lower end while providing superior quality.
The direct-to-consumer market segment certainly meets all of the criteria and is a growing segment while removing intermediaries like resellers, producers, and other businesses that stand between a brand and its end buyer. This brings the company closer to its target market.
For the same reason, we require a metric system in place to calculate and provide results that will assist us in understanding what makes D2C a cutting-edge segment.
What is the D2C segment of the market?
Direct-to-consumer (or D2C) businesses manufacture and ship their products directly to customers, bypassing conventional retailers and other middlemen.
The uniqueness of the D2C brands depends on taking accountability over the manufacturing, marketing, and distribution of their products, and selling them at reduced prices than conventional stores.
D2C metrics enable us to monitor key performance indicators and effectiveness, allowing us to develop new strategies to overcome challenges and improve the overall process, resulting in a positive outcome.
So, let’s look at the following key metrics in the D2C business.
10 D2C Metrics and KPI’s
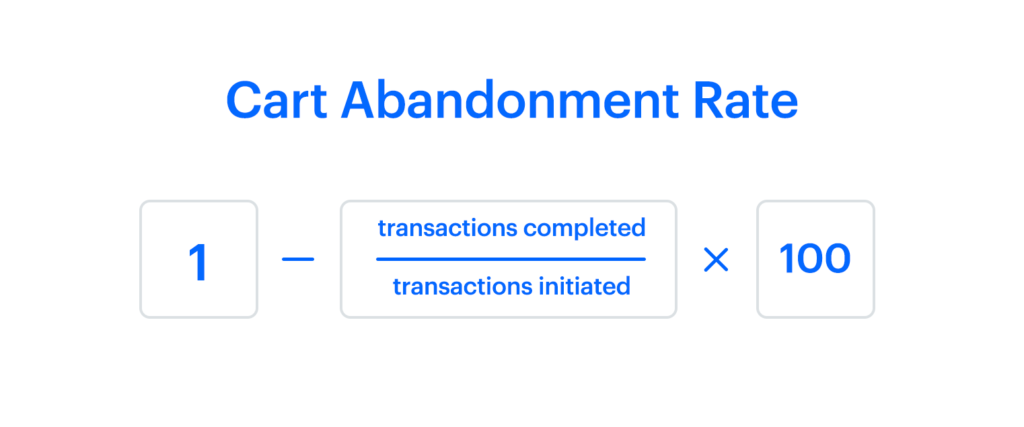
1. Cart Abandonment Rate
When a potential consumer begins the checkout process for an online order but abandons it before completing the transaction, this is known as shopping cart abandonment. Whatever item that a shopper adds to their shopping basket but never completes the transaction is labeled “abandoned.” Shopping cart abandonment is a critical component of the online shopping experience that companies monitor closely.
The total number of completed transactions is divided by the total number of transactions that were beginning to get the shopping cart abandonment rate. This rate determines what percentage of a website’s users indicate buying intent by adding an item to their cart but do not finish the transaction.
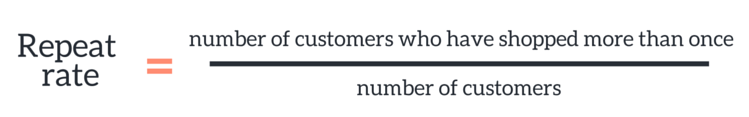
2. Repeat Customer Rate (RCR)
A repeat customer is someone who has made at least two purchases on your website. There is generally no time constraint on what qualifies as a repeat customer. A repeat customer is someone who made their initial transaction on your site a year ago and only made their second buy just the other day.
It is a KPI that is often measured by e-commerce organizations and is usually given as a percentage. It’s especially useful for assessing your total customer experience and determining how much value your customers derive from your store.
3. Customer Acquisition Cost (CAC)
The cost of acquiring a customer to purchase a product or service is referred to as the Customer Acquisition Cost (CAC). Customer acquisition costs are frequently linked to customer lifetime value as an essential parameter financially (CLV or LTV). With CAC, any company can determine how much it costs to acquire each customer.
In the D2C segment of the market, maintaining low CAC expenses entails more than just finding low-cost strategies to attract new consumers. It also necessitates relying on the quality of your products, services, or brand to keep them coming back.
Rather than paying for a steady individual on the run, prolonging the lifetime of each customer allows your business to expand faster and more economically.

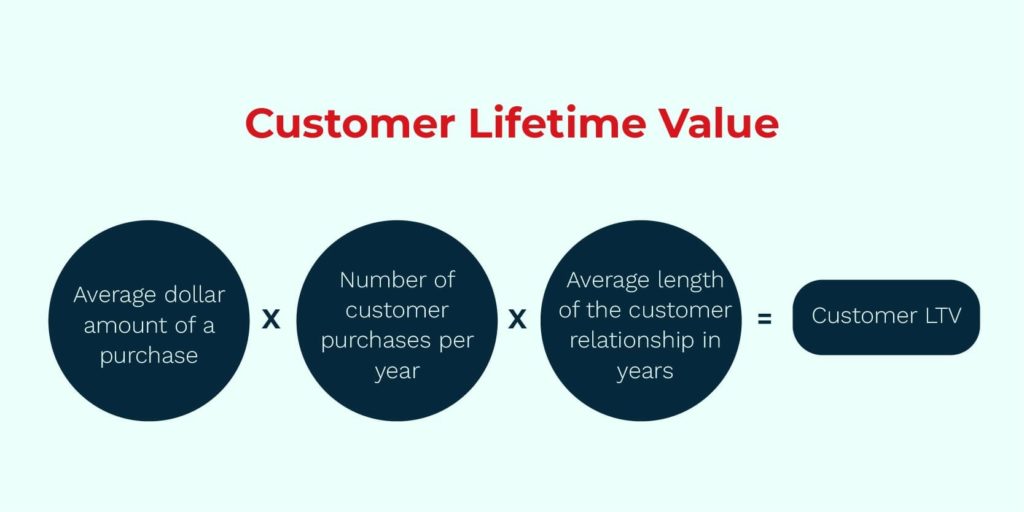
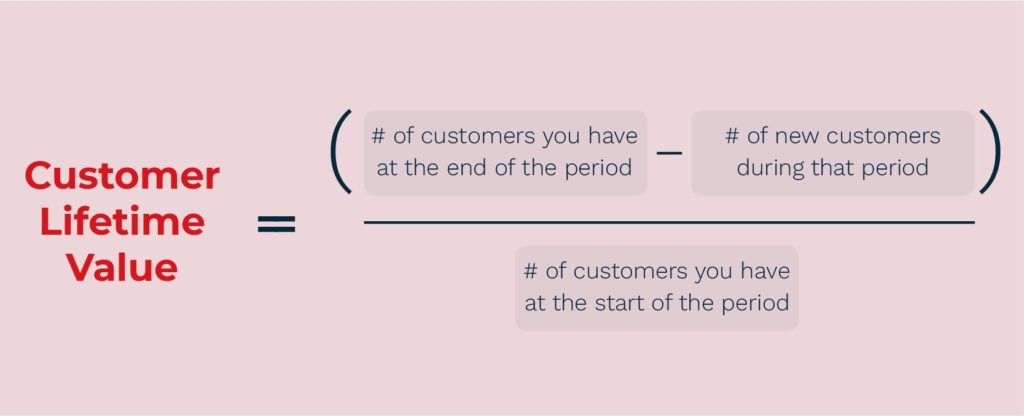
4. Customer Lifetime Value (CLTV)
One of the most important D2C metrics is to monitor customer experience programs to calculate the customer lifetime value (CLV). CLV is a metric for determining how important a customer is to your business, not just for a single purchase, but for the entire relationship.
D2C brands are typically specialized, catering to a narrow audience. This, along with a historically restricted product selection, hinders expansion. Customer lifetime value (CLTV) rises in conjunction with customer retention. This improves the financial stability of your company and allows you to invest in new items, new markets, and even new customer acquisition if necessary.
5. Customer Retention Rate (CRR)
The percentage of existing customers who stay with you after a certain amount of time is known as the customer retention rate. In the D2C segment, your customer retention rate can help you better understand what keeps consumers coming back to your business whether it be the 1-day delivery, pricing, the promotional adverts and can also indicate areas where customer service could be improved.
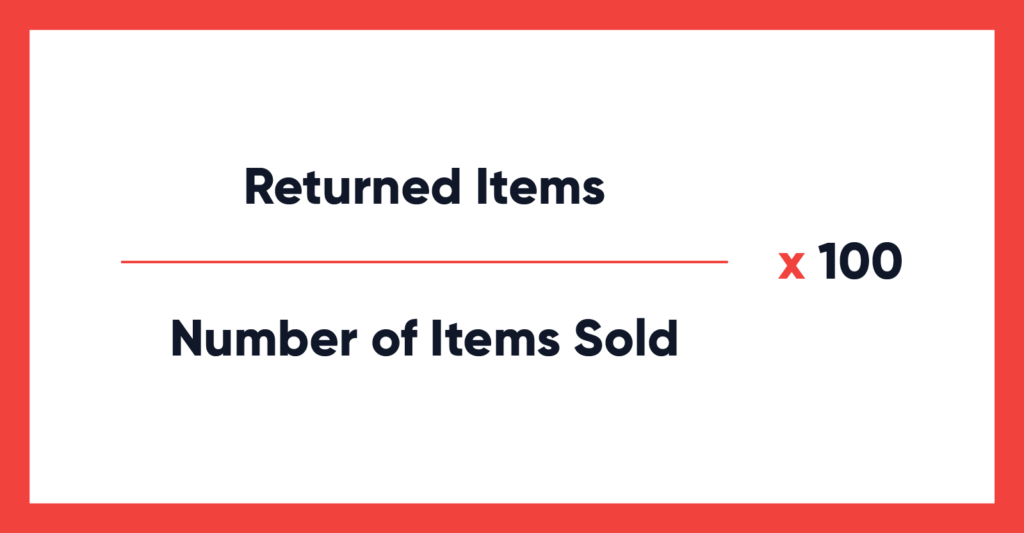
6. Product Return Rate
The regularity with which customers return things to your online store is referred to as your e-commerce return rate. Return rates in e-commerce are expressed as a proportion of the total number of products sold in a certain time period.
The percentage of online returns varies greatly depending on the generosity of the retailer’s return policy and the products being sold. This is why you should never take e-commerce return rates at face value.
7. Product Margin
The profit margin of a product indicates how much it sells over its actual cost. To put it another way, it displays how much “markup” is included in the selling price. This useful indicator identifies which goods in a company’s line generate the most income in relation to their cost.

8. Average Order Value
The average order value (AOV) is a D2C metric that calculates the average sum of all orders placed with a merchant during a specific time period. AOV is one of the most significant indicators for online retailers to understand since it influences crucial business choices including ad expenditure, store layout, and product pricing.

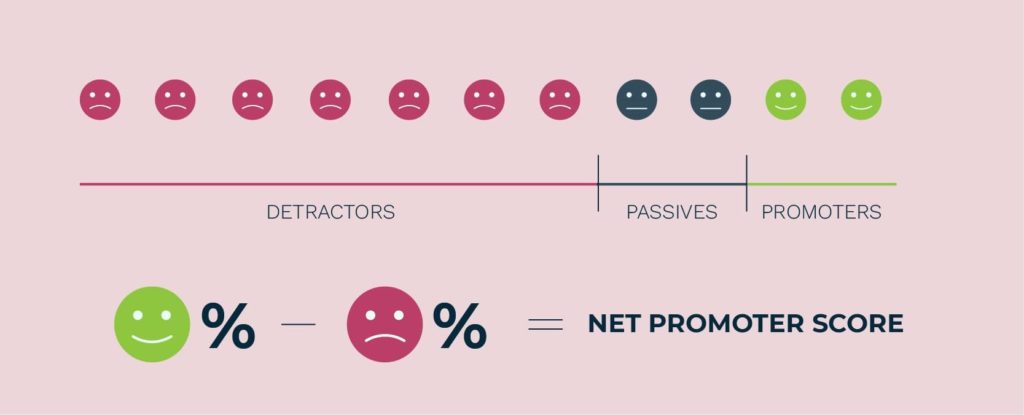
9. Net Promoter Score (NPS)
Net Promoter Score is a metric that may be calculated and tracked on a regular basis, not just for a company, but also for each business, product, shop, or customer service team. Customer segments, geographic units, and functional groups can all be tracked. It assists everyone by focusing on the twin objectives of increasing promoters and decreasing detractors. Simply put, it’s your customer balance sheet.
10. Net Revenue Retention (NRR)
The percentage of recurrent income retained from existing customers over a certain time period is known as net revenue retention (NRR) (usually monthly or annually). Upgrades, cross-sales, downgrades, and cancellations all contribute to revenue. As a result, this is the total monthly recurring revenue from all consumers.

5 Fascinating Stats about D2C brands that make them ‘Unconventional’:
- 81% of consumers will make at least one D2C purchase over the next 5 years. (RetailDive)
- According to data by KPMG, India currently has over 800 D2C brands, with the sector being worth approximately $44.6 billion in 2021 and projected to touch $100 billion by 2025.
- As Deloitte reports, the product categories that are most popular in the American D2C landscape are women’s clothing (54%), footwear (17%), and accessories (7%).
- According to Emarketer, the food and beverage D2C space is set to grow by 21% by the end of 2021. Part of this growth is due to the boost in grocery delivery during COVID.
- The D2C fitness segment rising hero Peloton’s revenue hit an all-time high of 1.06 billion in Q2 2021. After raising a $550M Series F in 2018, the startup IPO’d in late 2019 at an $8.1B valuation and now has a $44B market cap. And the connected bike maker just increased its 2021 fiscal revenue projection to $3.9B (up from $3.5B).
D2C Brand Strategy Metric: A Scale of Upgradation
D2C brands are here to thrive, thanks to the advent of eCommerce and consumers becoming more knowledgeable about brands. The ability of a brand to integrate its growth plan to the expectations of customers in order to deliver ongoing value determines whether or not it is a viable business model. Offering a subscription is the best way to do this.
Kapture enables D2C brands to achieve their customer-centric goals in the most promising manner, accelerating growth and initiating suggestions whenever possible in the process for reaching greatness!
Keep in mind that retention is not an assumption. Therefore, taking initiatives continuously will be a viable solution to generate as much profitability as feasible.
About the Author | |
 | Raajdeep Saha Content Writer |
| Raajdeep Saha is a published poet and writer. He previously worked as a marketing executive and a creative writer for a product-based company and therefore holds technical knowledge in the marketing and advertising domain. He has worked on several blogs, ad copies, transcripts and is now contributing the same at Kapture CRM. | |
Follow Raajdeep on Social Media
| |