
Ecommerce Customer Experience Statistics
In this age of rapid digitalization, businesses across the globe have seen a shift in the mode of business being conducted.
From physical spaces to virtual spaces to provide customers an e-commerce experience has now become the need of the hour. However, the shift to an eCommerce model of business can be a hectic, time and resource-consuming process.
In times like this, businesses need to keep an eye on e-commerce customer experience statistics.
These statistics will not only help businesses get a clear idea of trends and consumer behavior but will also help them make data-driven decisions.
Here are 50 eCommerce customer experience statistics that every business should pay attention to –
Table of Contents
General Customer Support Stats for Ecommerce Experience
Efficiently handling customer service operations in this age of rapid digitization can be challenging. Customer service managers and help desk agents need to have a general understanding of the potential impact that customer service teams can produce.

1. About 96% of customers admit that customer service is just as important as brand loyalty.(Source – Microsoft)
2. 53% of shoppers believe their feedback doesn’t go to anyone who can act on it. (Source – Microsoft)
3. A customer is four times more likely to switch to a competitor if the problem they’re having is service-based. (Source – Bain and Company)
4. About 89% of businesses tend to compete with each other based on customer service. This is where net promoter scores come into the picture. (Source – Gartner)
5. 70% of unhappy customers, who managed to get their problems resolved, are open to shopping with the same business again because of good service. (Source – Glance)
6. Businesses that are known to deliver top-notch customer service experience are known to do about 4% to 8 % better than other businesses of the same nature. (Source – Bain and Company)
7. The cost of acquiring a new customer is about 7 times higher than retaining an existing one. This is the reason customer retention is so important. (Source – Huffpost)
8. Around 75% of businesses have admitted that they measure customer engagement however they cannot provide a proper breakup of what the engagement is. (Source – Huffpost)
9. Loyal customers like special treatment. 48% have admitted they feel good when they are prioritized. (Source – Accenture)
10. 95% of adults between the ages of 18-34 are likely to follow a brand through social media channels. (Source – MarketingSherpa)
11. Good customer service means more sales. 52% of buyers have admitted to making additional purchases from the same brand based on customer service experience. ( Source – Dimensional Research)
12. 94% of American customers will recommend a company whose service they rate as “very good.” (Source – Qualtrics XM Institute)
Self-Service Portals Statistics
A lot of customers these days prefer solving their customer service tickets all on their own. Customers love the idea of being independent which is why businesses are encouraging and making this possible through self-service portals. Knowledge management systems that can be accessed by customers to help themselves out are great customer service tools.

13. Across industries, fully 81% of all customers attempt to take care of matters themselves before reaching out to a live representative (Source – Harvard Business Review)
14. 77% of consumers report having used a self-service portal (Source – Microsoft)
15. 59% of surveyed banks and credit unions report that consumer self-service is very important at their institution.(Source – Engageware)
16. 70% of consumers say they prefer messaging over calling for customer support (Source – IBM Watson)
17. 79% say they expect organizations to provide self-service support tools to help customers find answers without having to contact support. (Source – Vanillaforums)
18. Customers prefer knowledge bases over all other self-service channels. (Source – Forrester)
19. 28% of consumers say the most frustrating issue is information that is simple but hard to find. (Source – Drift)
Omnichannel Ecommerce Customer support statistics
Assisting customer service needs from multiple channels and platforms to help businesses make the customer experience much more smooth and efficient. Facilitating an Omnichannel support strategy in place provides customer service teams and businesses numerous advantages.

20. Marketers using three or more channels in any one campaign earned a 287% higher purchase rate than those using a single-channel campaign. (Source – Omnisend)
21. The effectiveness of bots in resolving issues has fallen to 28%. American consumers do not find bots effective, with 40% relying on other channels to reach out to service teams. (Source – Microsoft)
22. 15 years ago the average consumer typically used two touch-points when buying an item and only 7% regularly used more than four. Today consumers use an average of almost six touch-points with nearly 50% regularly using more than four. (Source – Marketing Week)
23. 77% of strong omnichannel companies store customer data across channels, compared to 48% for weak omnichannel companies. (Source – Aberdeen Group)
24. Omnichannel shoppers have a 30% higher lifetime value than those who shop using only one channel. (Source – Google)
25. Companies with extremely strong omnichannel customer engagement see a 9.5% year-over-year increase in annual revenue, compared to 3.4% for weak omnichannel companies. Similarly, strong omnichannel companies see a 7.5% year-over-year decrease in cost per contact, compared to a 0.2% year-over-year decrease for weak companies. (Source – Aberdeen Group)
Latest Trends in E-commerce Customer Support
Keeping up with the latest trends is a must-do for customer service managers and help desk agents. It helps them identify areas where they can improve or enhance operations and allows them to keep up with the competition.
26. According to a recent survey, 40% of customers believe that most businesses have now focused more attention on customer service. ( Source – Microsoft)
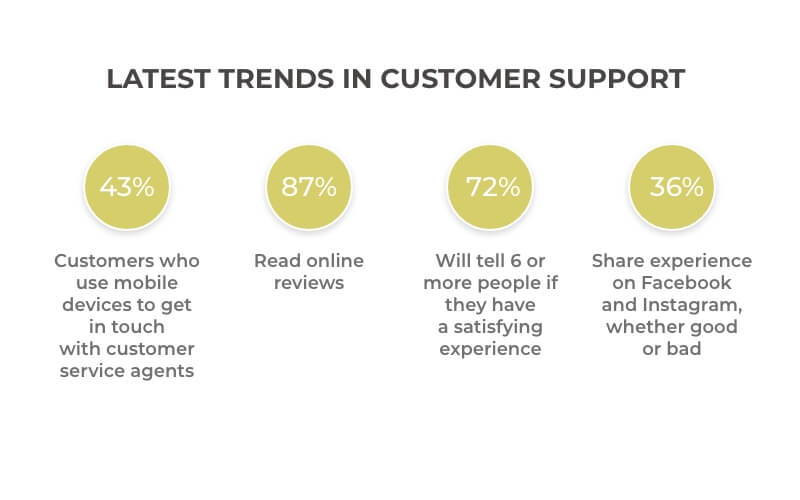
27. % of customers who use mobile devices to get in touch with customer service agents find it a more pleasurable experience. (Source – Microsoft)
28. 87% of consumers read online reviews for local businesses in 2020. (Source – Bright Local)
29. 72% of customers will tell six or more people if they have a satisfying experience. (Source – Esteban Kolsky)
30. 36% of consumers will share their customer service experience, whether good or bad. More than one-third report posting on Facebook, followed closely by Instagram. (Source – CFI Group)
31. 79% of American internet users are on Facebook, making it the most popular social media platform. (Source – Lyfe Marketing)
Impact of Negative Customer Experience Stats
Poorly trained customer service agents, lack of efficient customer relationship management tools can create negative customer experiences which can not only lead to a negative brand image but can also affect profitability.

32. 4 out of 10 customers have admitted to not recommending a business when they have had a bad customer experience. (Source – Cloudfront)
33. Stats indicate that companies have lost almost 1.6 trillion dollars in the United States alone due to bad customer service. (Source – Accenture)
34. Approximately 47% of customers have admitted that they have stopped purchasing from certain brands or websites because they were not impressed with the customer service or the after-sales service that they received. (Source – Salesforce)
35. A survey also indicated that 91% of customers who are unhappy with customer service choose to switch businesses without intimation. (Source – Huffpost)
Negative Feedback Statistics
Keeping a lookout for possible mishaps is necessary. Negative feedback can not only bring down sales numbers but can also decrease brand visibility.

36. When you have a negative customer experience, it will take 12 positive feedbacks to make up for that one negative feedback. (Source – Glance)
37. Globally, 52% of customers believe that businesses need to pay more attention to the feedback provided by them and take action accordingly.(Source – Microsoft)
38. About 62% of customers have admitted sharing negative and bad experiences with others. (Source – Salesforce)
Customer Support Chatbot Statistics
The usage of intelligent chat applications and chatbots for customer support is becoming prevalent day by day. From cutting down operational costs to increasing CSAT scores, chatbots are helping help desk teams become more efficient and productive.

39. 67% of global consumers had an interaction with a chatbot over the last 12 months (Source – Invesp)
40. The vast majority (87.2%) of consumers have neutral or positive experiences with chatbots (Source – Drift)
41. The number 1 use case for chatbots is to get a quick answer to a query (Source – Drift)
42. 3% of consumers use conversational marketing tools for purchases (Source – Drift)
43. The average satisfaction rate of bot-only chats is 87.58% (Source – Comm100)
Customer Decision Making Statistics

Keeping an eye on customer decision-making trends and consumer buying patterns is extremely important. It helps businesses create better sales strategies and marketing strategies.
44. 83% of customers agree that they feel more loyal to brands that respond and resolve their complaints. (Source – Khoros)
45. 78% of customers have backed out of purchase due to a poor customer experience. (Source – Glance)
46. 90% of customers rate an “immediate” response as essential or very important when they have a customer service question. 60% of customers define “immediate” as 10 minutes or less. (Source – HubSpot Research)
47. Your online conversion rate can improve by roughly 8% when you include personalized consumer experiences. (Source – Trust Pilot)
48. 36% of consumers will share their customer service experience, whether good or bad. More than one-third report posting on Facebook, followed closely by Instagram. (Source – CFI Group)
49. The no.1 benefit of chatbots is 24/7 support, according to consumers (Source – Drift)
Conclusion
With a lack of efficient customer relationship management tools, handling eCommerce businesses can be a hectic task.
Without the right customer management technology, eCommerce businesses can not face problems with retention levels and onboarding rates, but can also witness lower profitability and decreased growth.
Investing in the right customer service CRM that makes the customer service process smooth and effective has become the need of the hour. To know more about such CRMs click here for a demo.